What are maps?
|
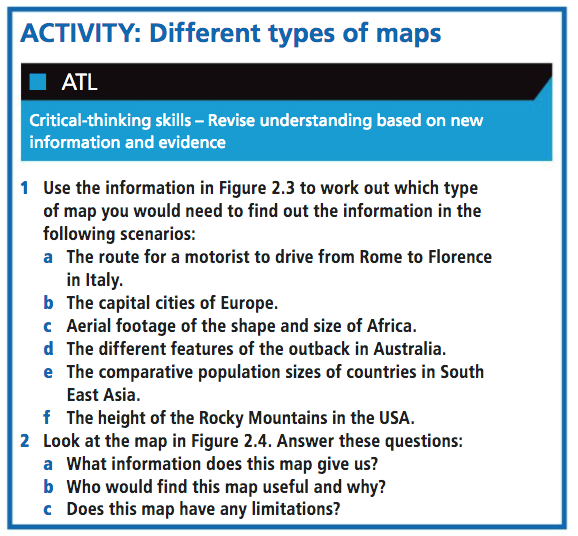
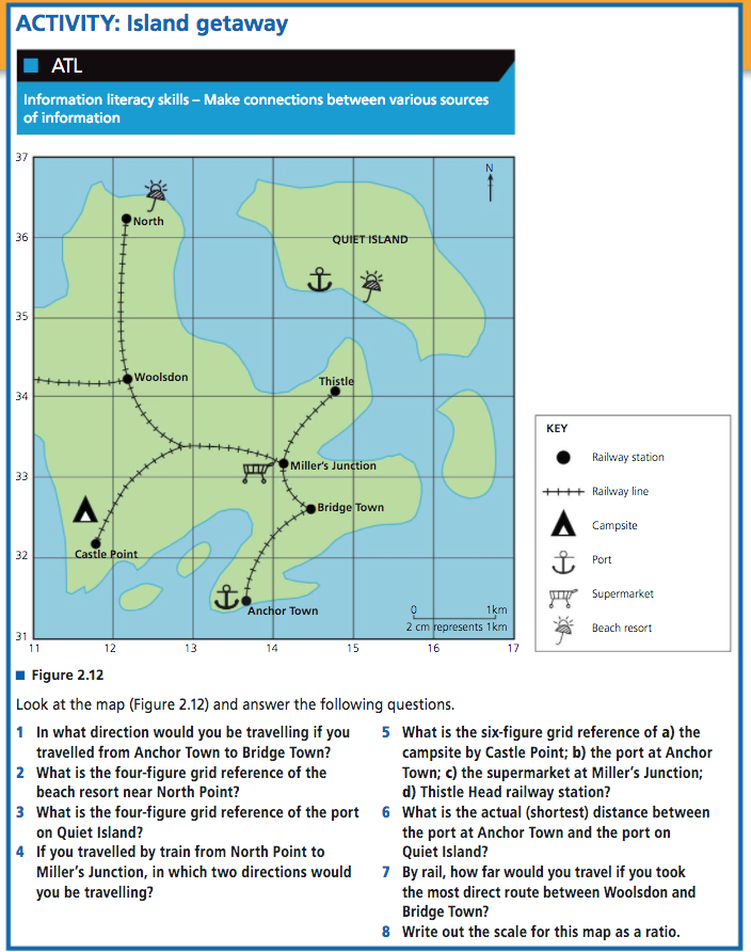
Textbook pages 28- 33. Look at the different maps below and answer the questions on the right.
Extension - explore these interactive and digital maps.
J.R.R. Tolkien's Middle-earth Middle Earth Digital Maps (Not iPad friendly) |
Extension - Khan Academy on the purpose of maps. Also research other types of maps not mentioned in this chapter; geological, historical and weather maps. What information do these maps provide?
|
How do we use maps?
|
|
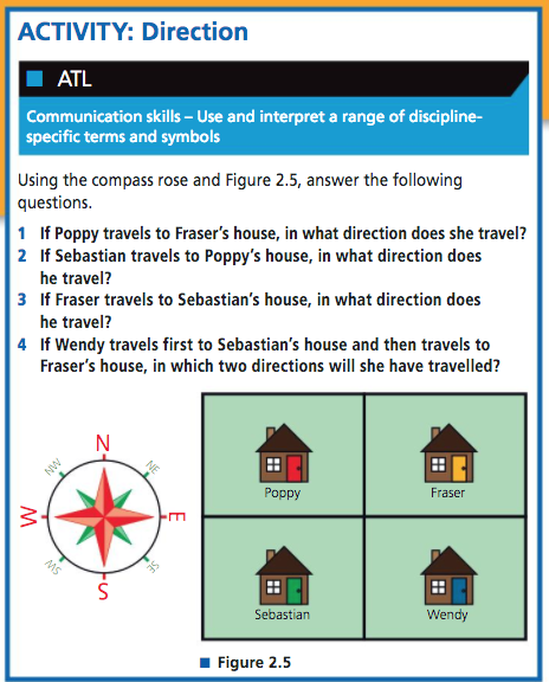
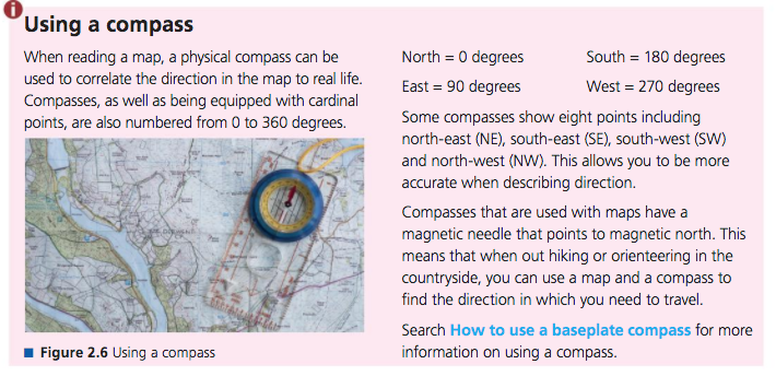
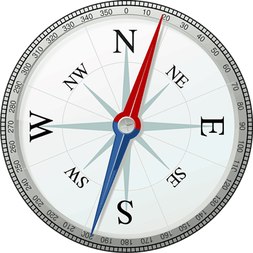
Direction
|
|
|
|
|
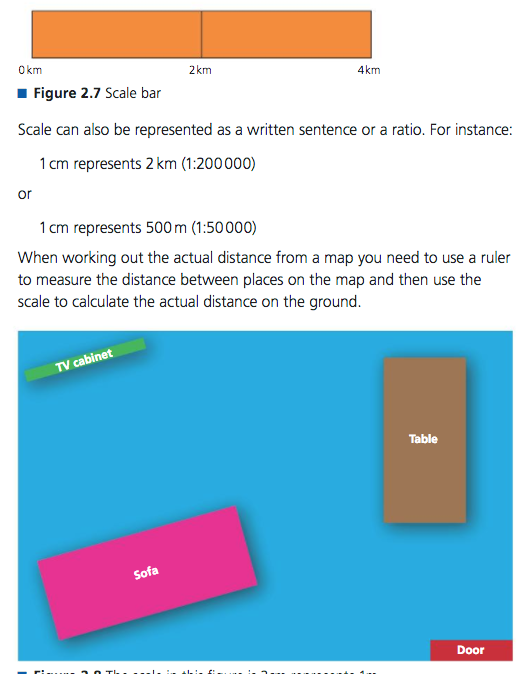
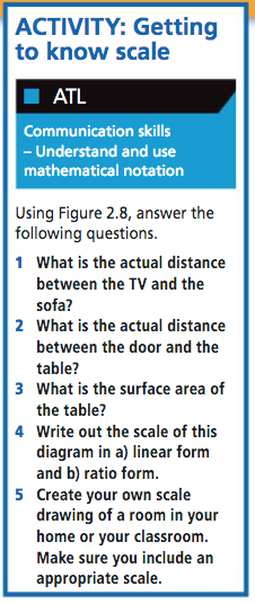
Scale
|
|
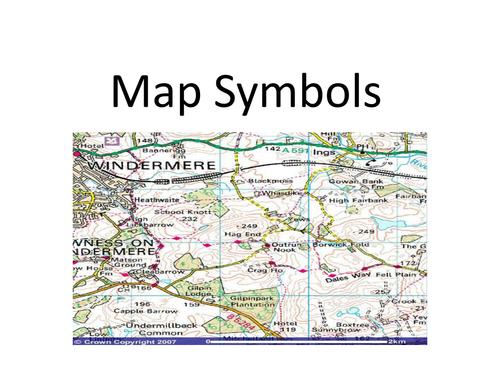
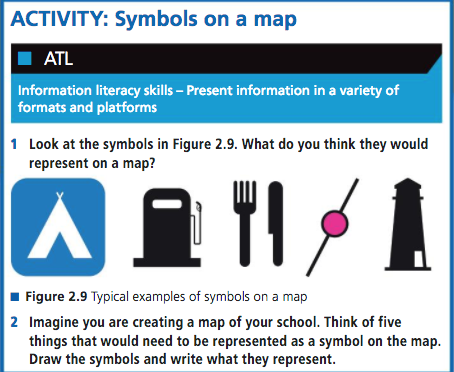
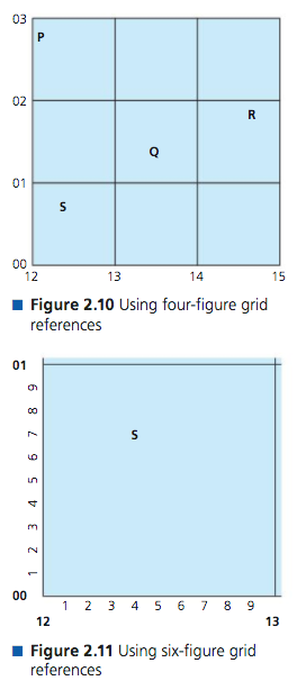
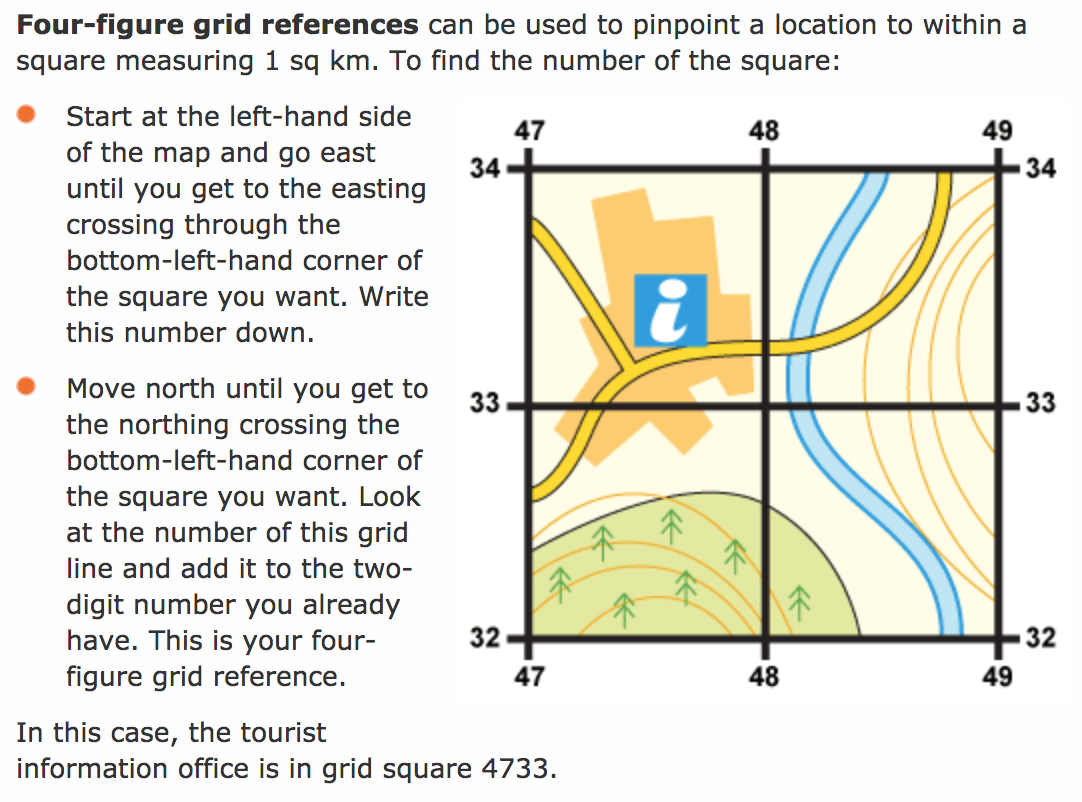
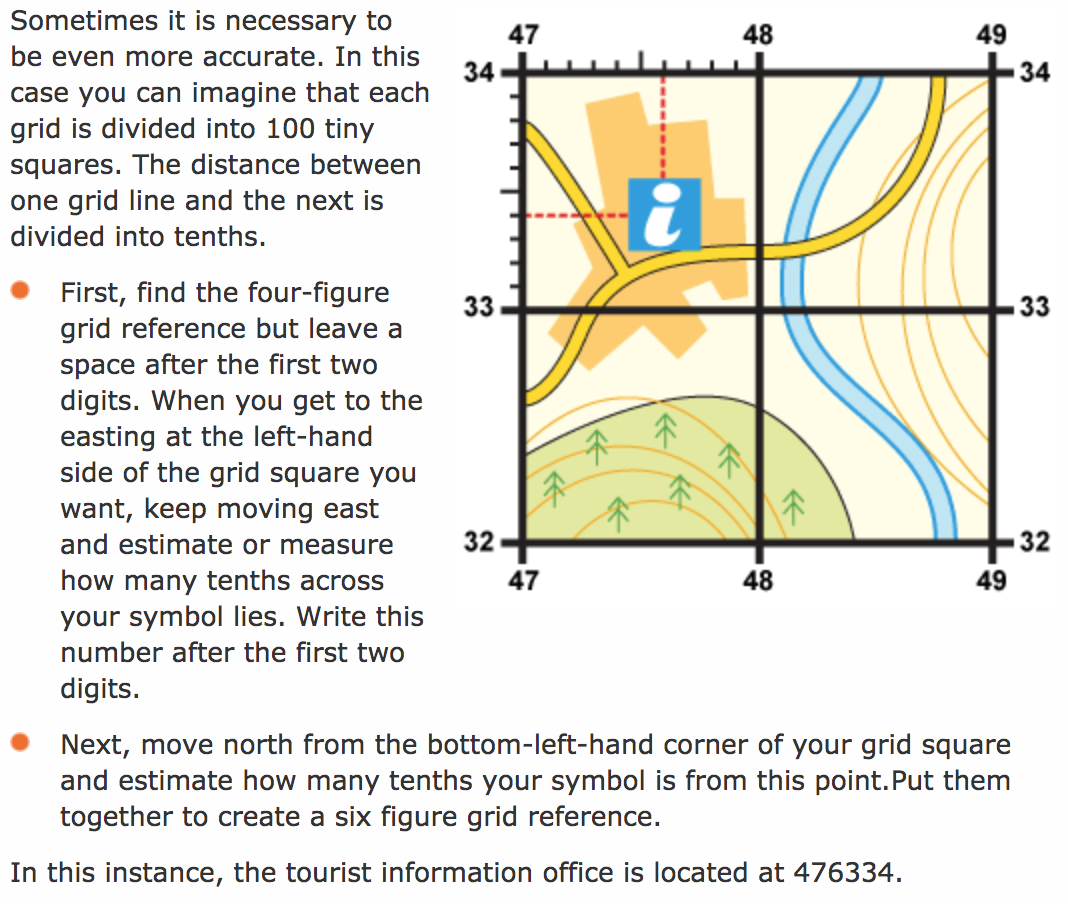
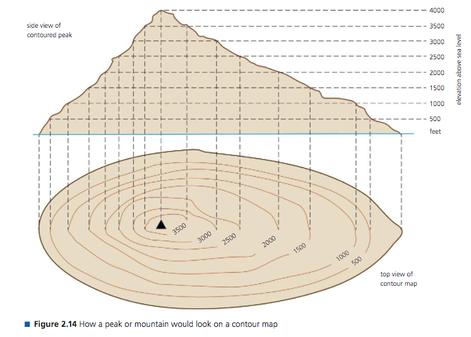
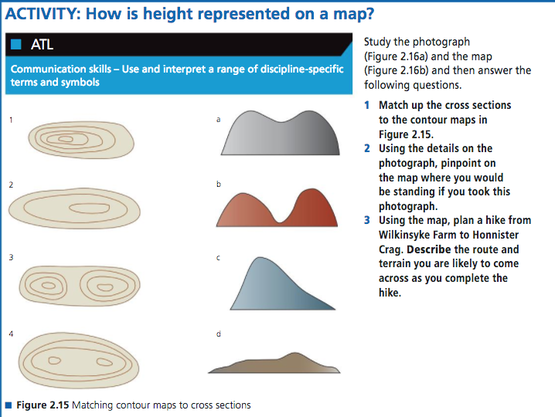
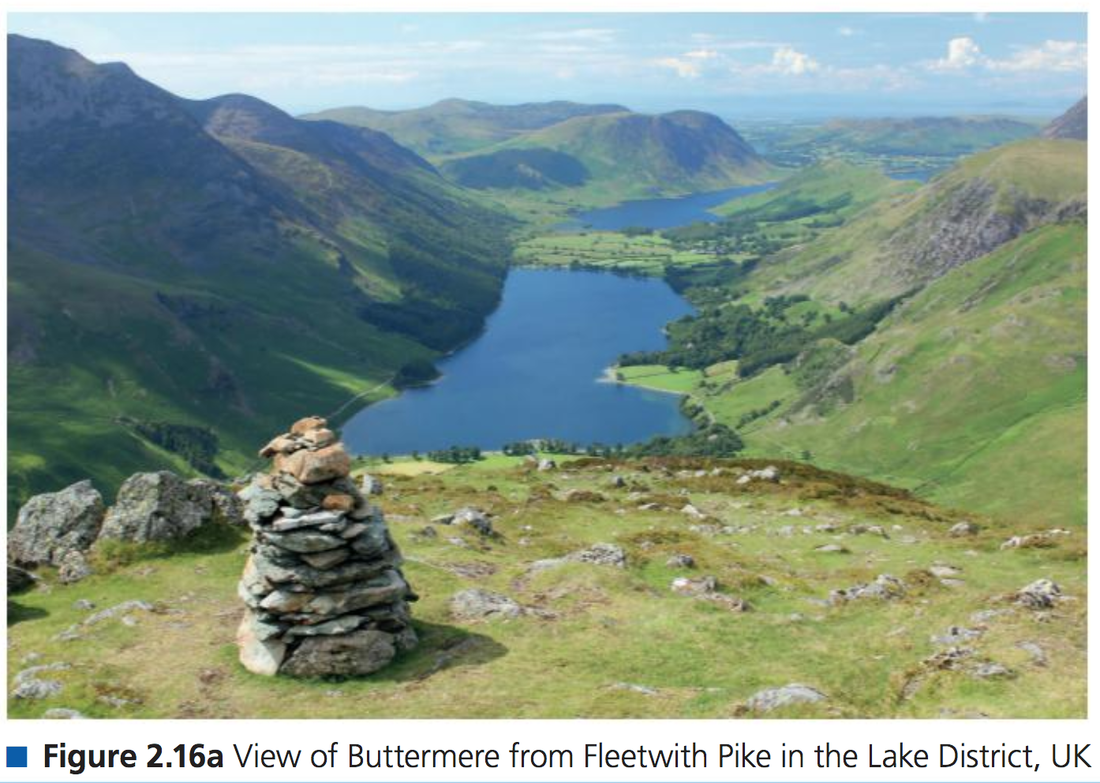
Symbols and Grid References
|
|
|
|
|
|
|
|
|
|
|
|
How can maps help us understand time, space and place?
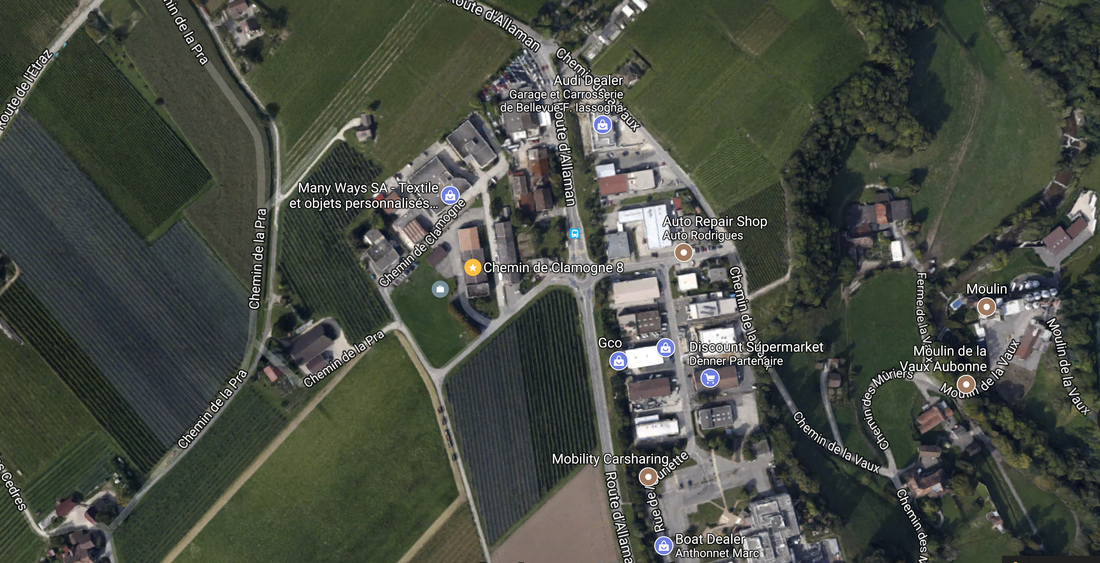
Here is the latest Google Maps satellite image of our school. Is it accurate? Is it useful?
Time
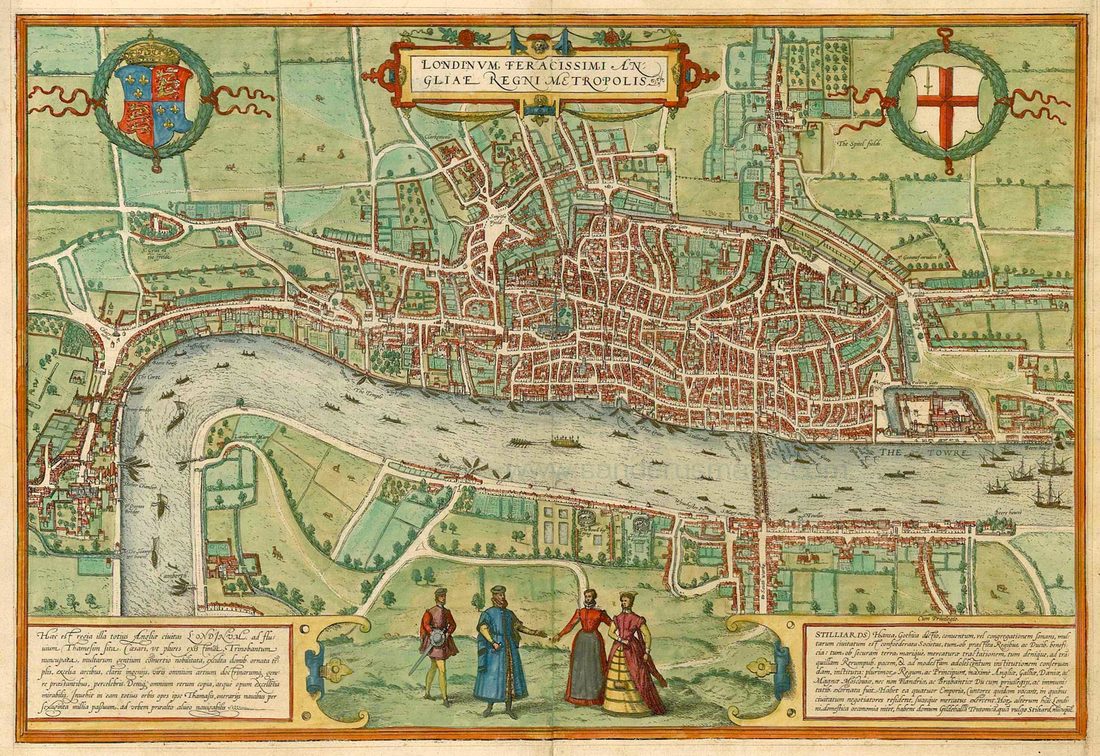
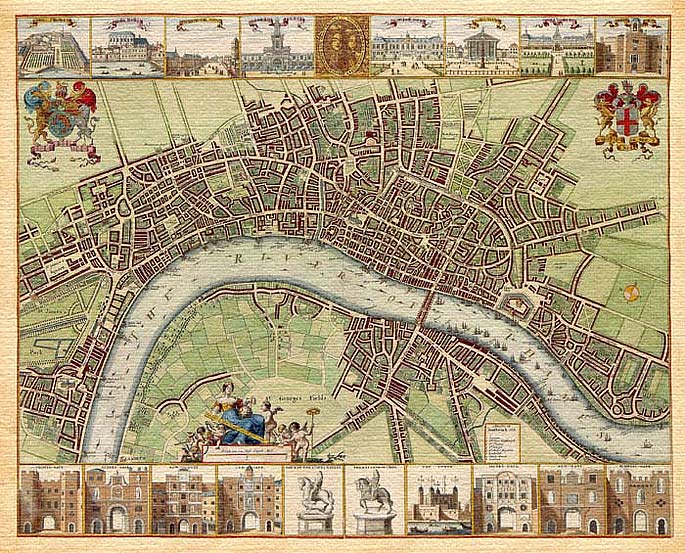
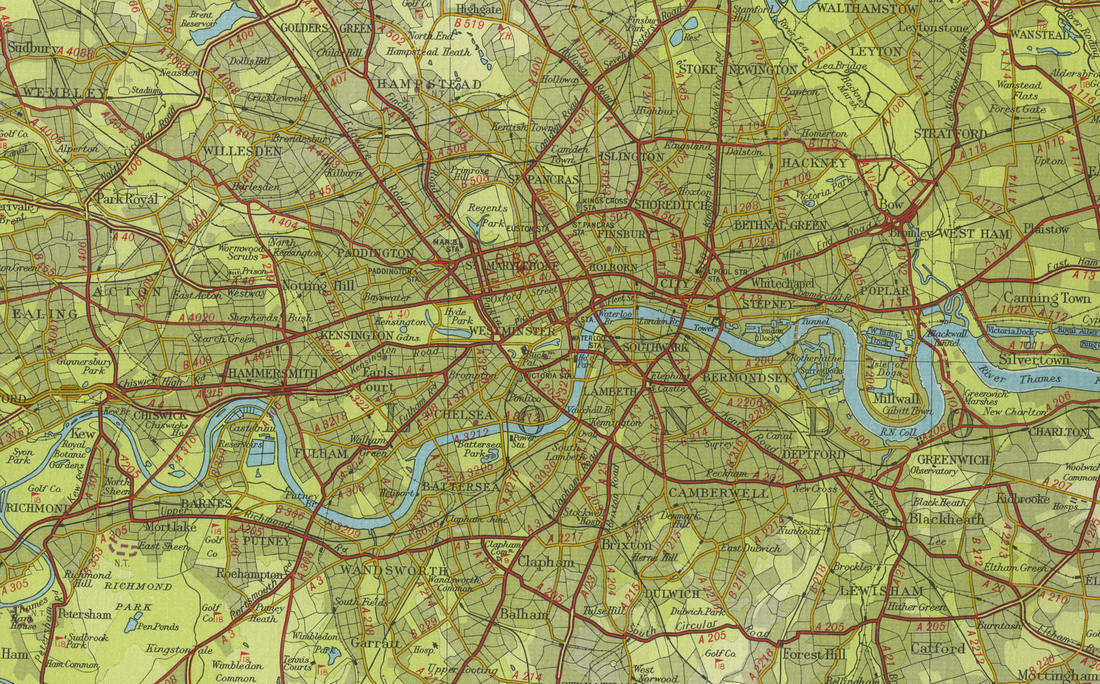
What can these maps of London in 1500, 1700, 1850 and 1950 tell us?

Place
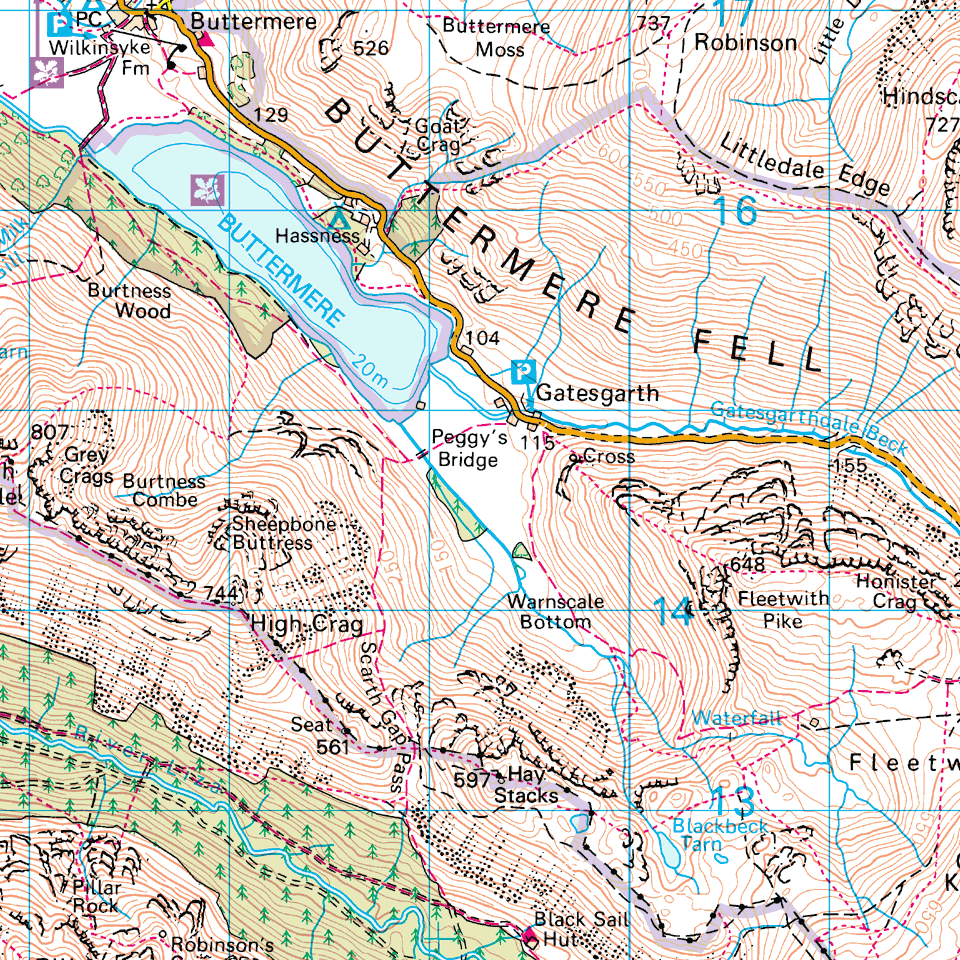
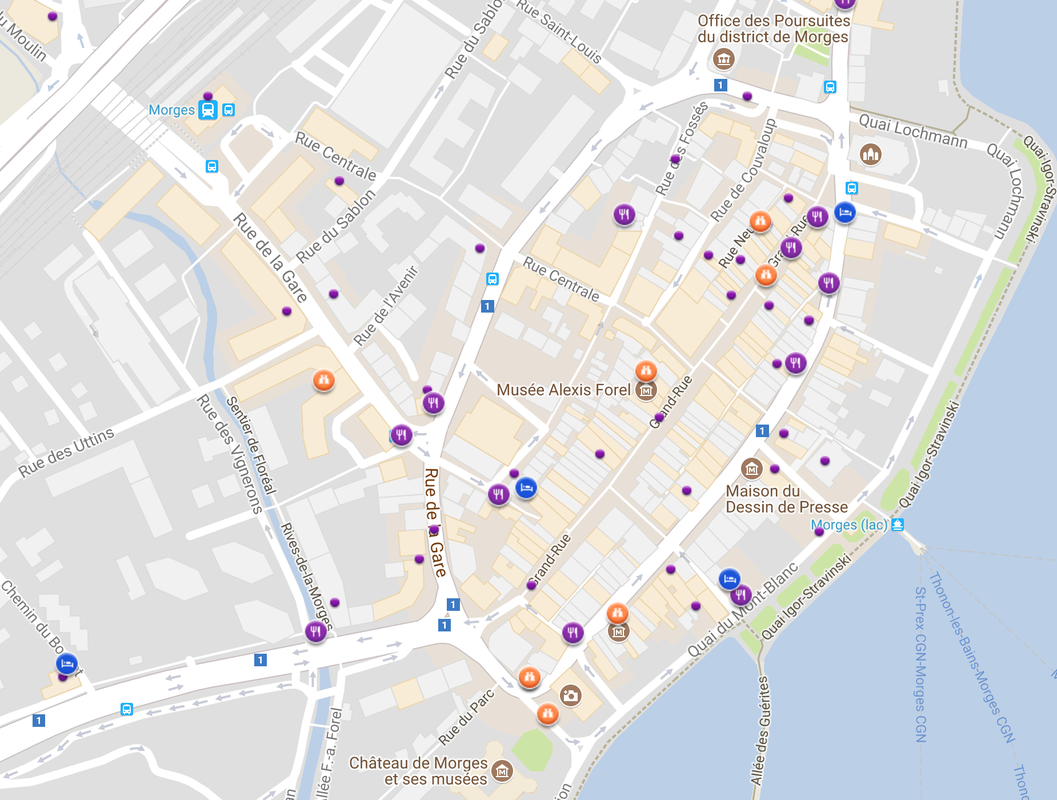
What different features of a place does the following map provide?
What different features of a place does the following map provide?
Space
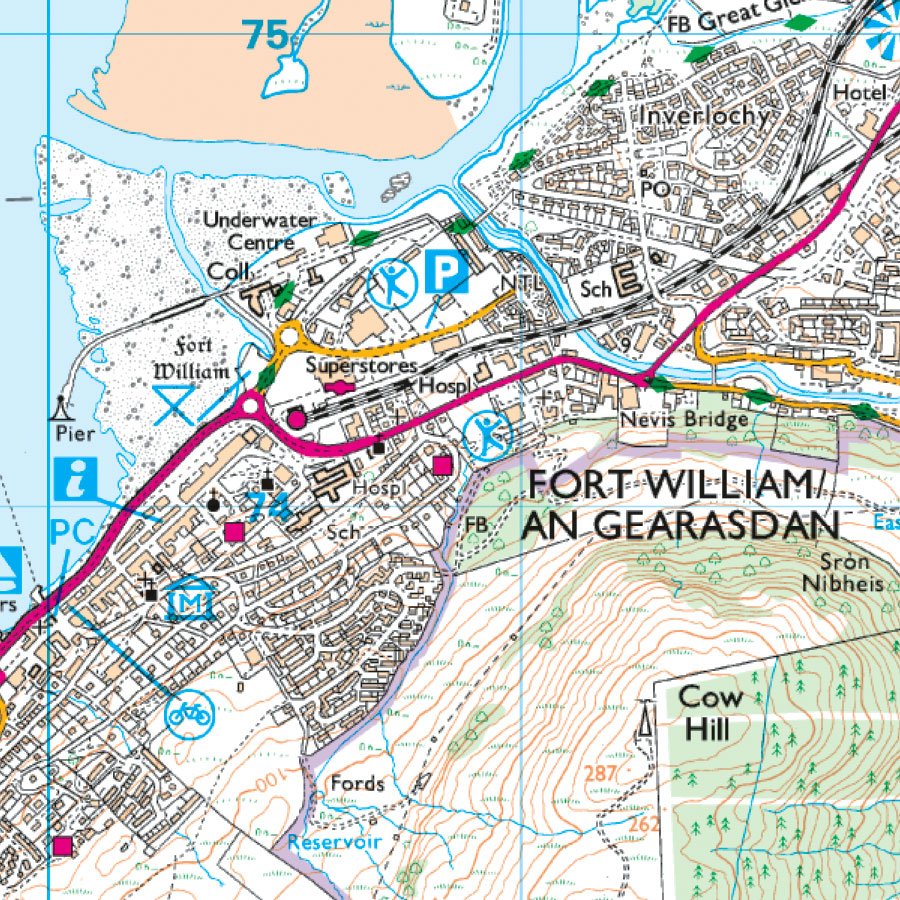
How can the following map help us understand the space it represents?
How can the following map help us understand the space it represents?
|
|
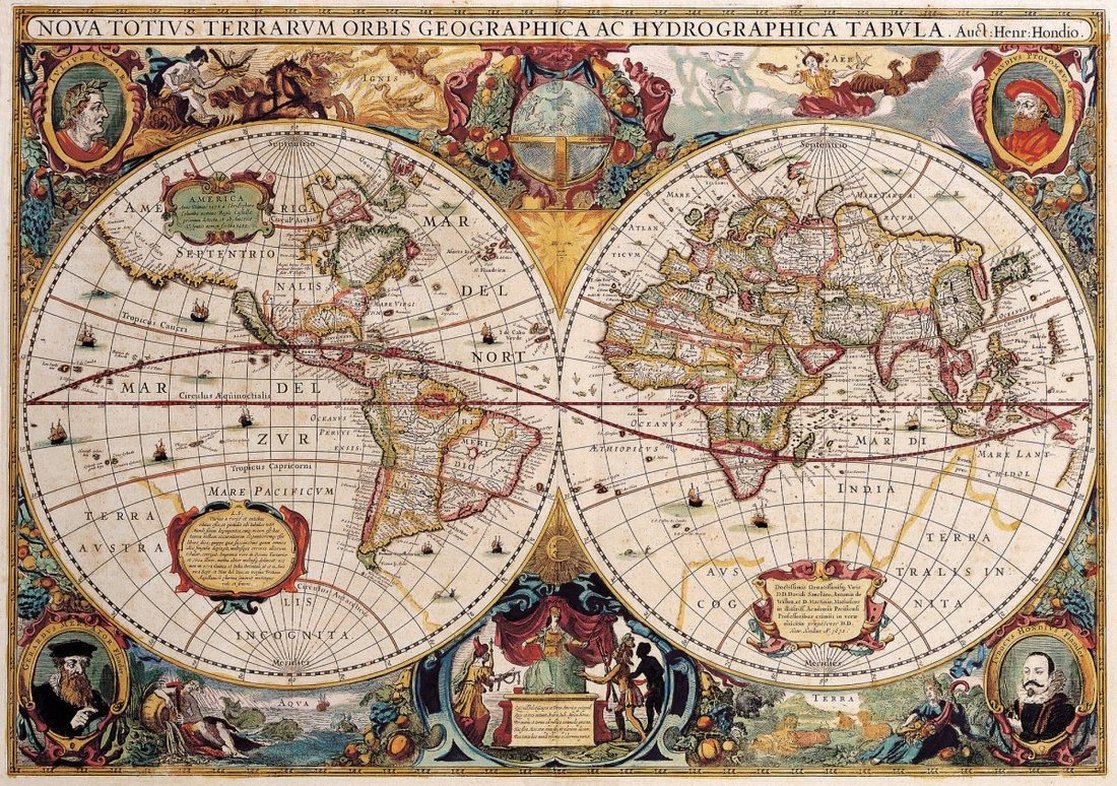
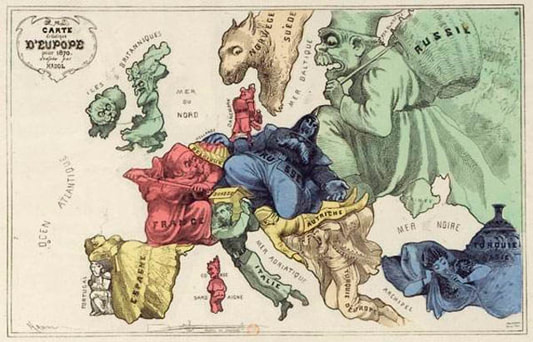
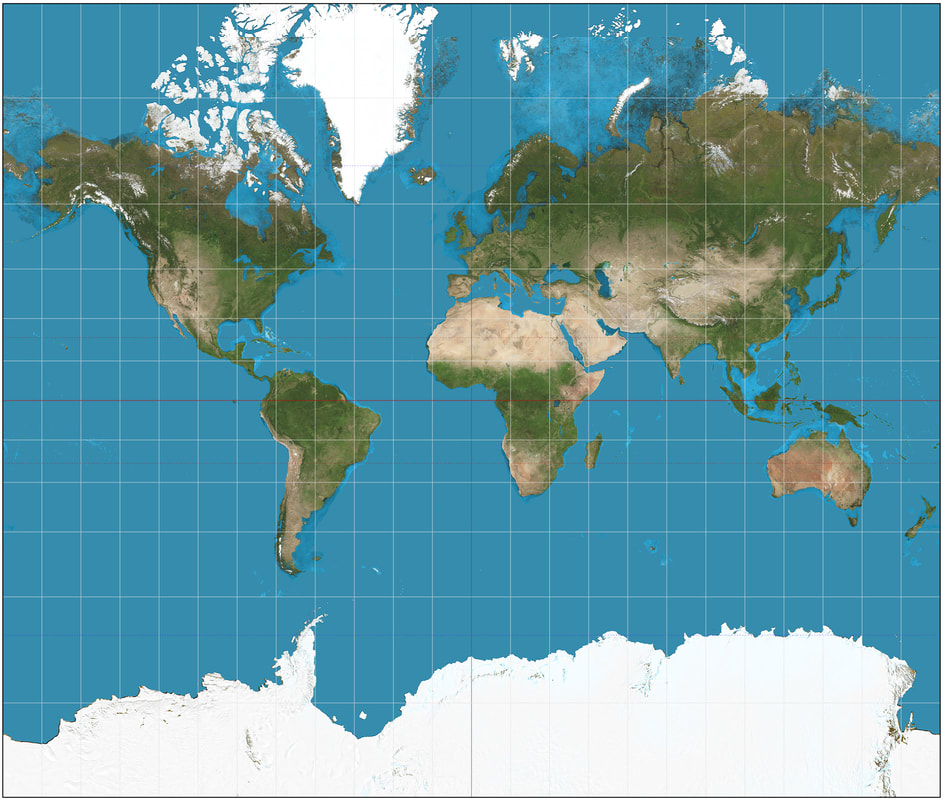
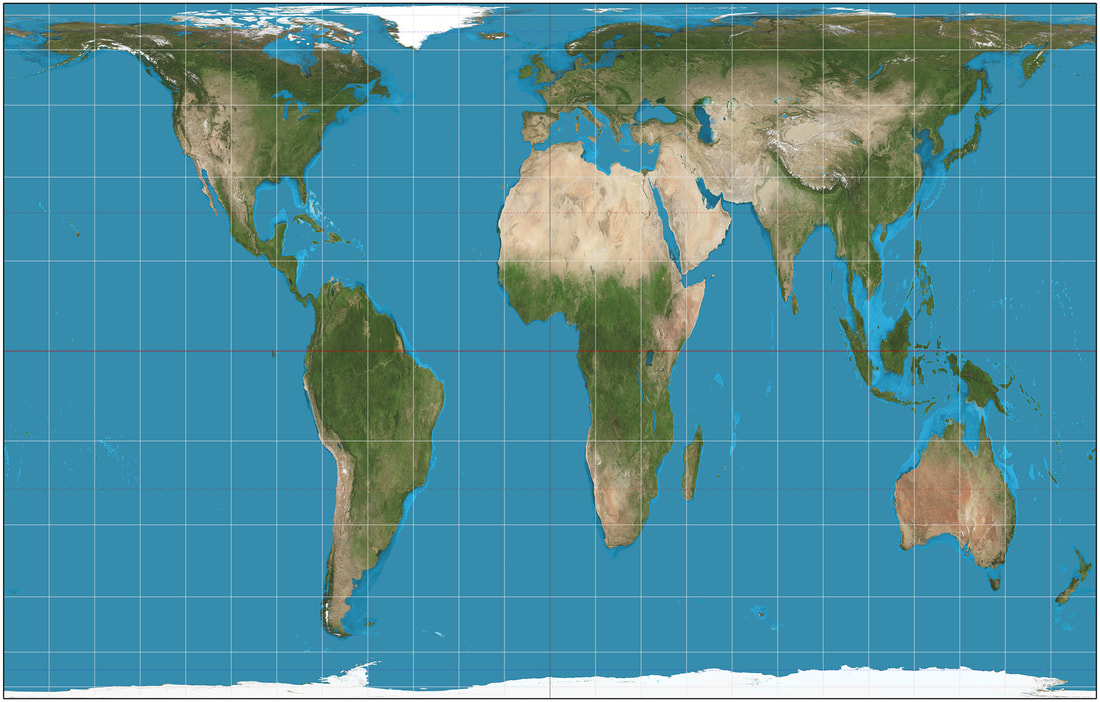
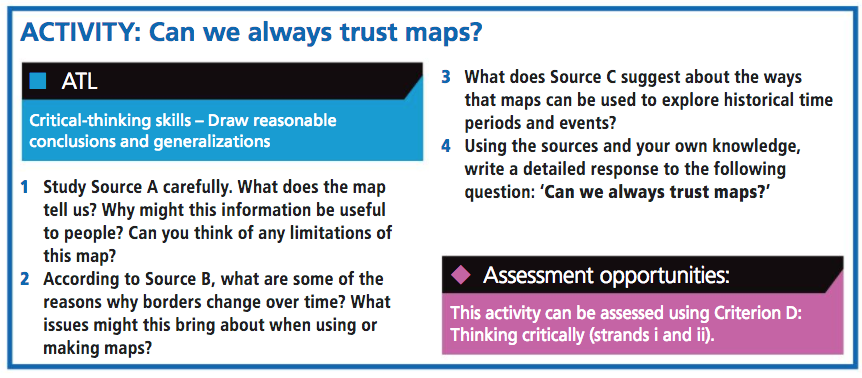
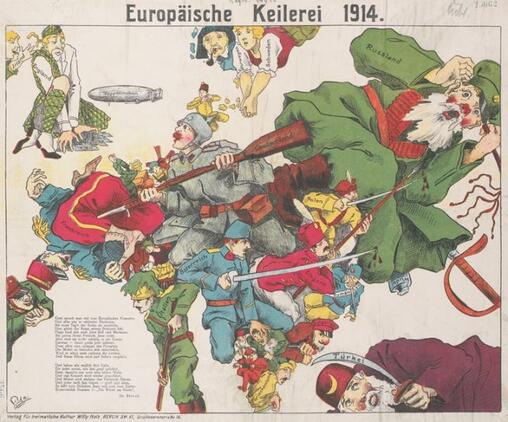
Can we always trust maps?
|
|
Assessment
You have the 4 lessons this week to complete the assessment.
Your task is to create a map that graphically represents an appropriate topic or issue.
Additional information is required, as you must also briefly analyse the patterns shown in the data and images used.
You must find and show evidence of generating your own data that you will then use to create your map and graphical representation. Reproducing an existing map as your own is not acceptable, clearly.
This can be a data set on virtually any topic, from the number of smokers in a country, region or globally, to the distribution of the most wealthy or successful football teams. Other ideas could include:
The possibilities are seemingly endless. However, you must be sure that your data is enough in amount and scope to be usable graphically.
You can work either on A3 paper using cut and paste, or on computer in a format that can be printed on to A3 paper.
Your task is to create a map that graphically represents an appropriate topic or issue.
Additional information is required, as you must also briefly analyse the patterns shown in the data and images used.
You must find and show evidence of generating your own data that you will then use to create your map and graphical representation. Reproducing an existing map as your own is not acceptable, clearly.
This can be a data set on virtually any topic, from the number of smokers in a country, region or globally, to the distribution of the most wealthy or successful football teams. Other ideas could include:
- Deforestation
- Tourism
- Car ownership
- Literacy rates
- Access to internet
- Number of deaths during WW1 or WW2
- Football kit by brand
The possibilities are seemingly endless. However, you must be sure that your data is enough in amount and scope to be usable graphically.
You can work either on A3 paper using cut and paste, or on computer in a format that can be printed on to A3 paper.
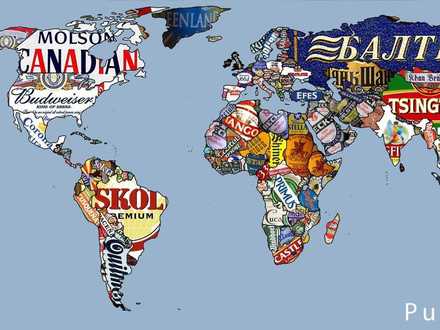
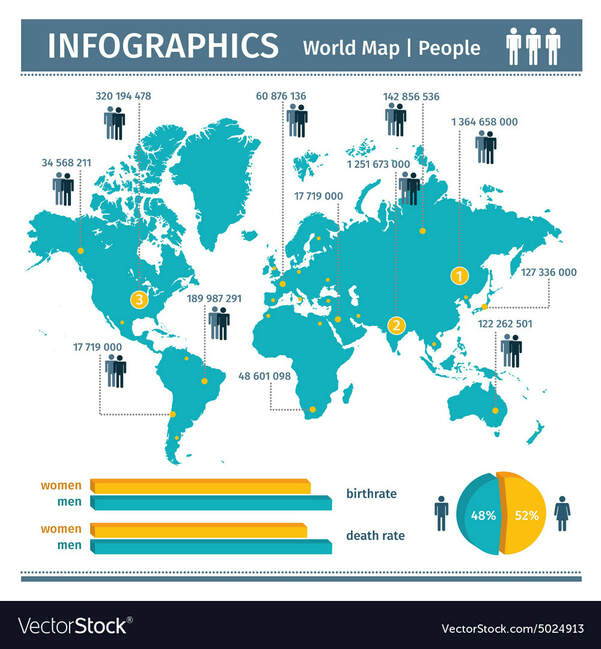
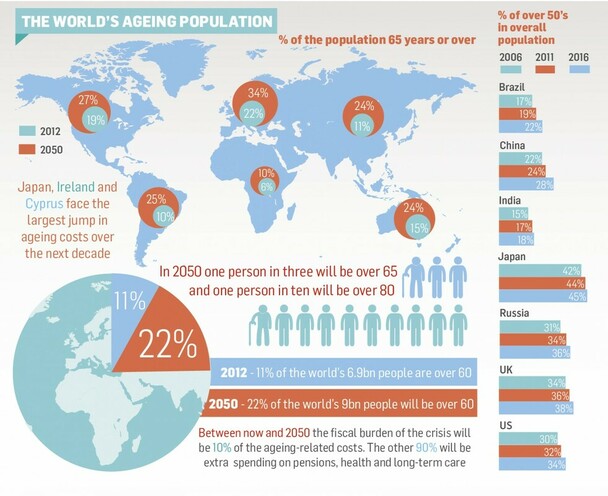
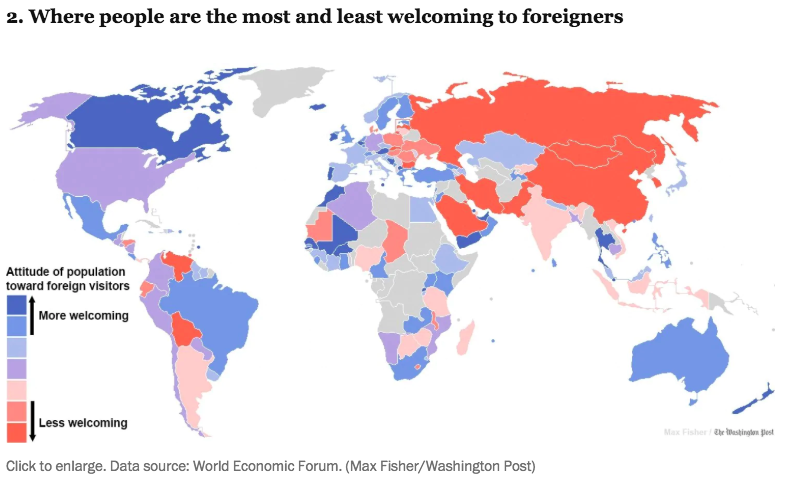
Here are some examples of mapping that show issues, data and a range of design ideas.
|
|
|
|
|
Criterion A: Knowing and understanding
i. use vocabulary in context ii. demonstrate knowledge and understanding of subject-specific content and concepts, using descriptions, explanations and examples. 0 The student does not reach a standard described by any of the descriptors below. 1–2 The student: i. recognises some vocabulary ii. demonstrates basic knowledge and understanding of content and concepts through limited descriptions and/or examples. 3–4 The student: i. uses some vocabulary ii. demonstrates satisfactory knowledge and understanding of content and concepts through simple descriptions, explanations and/or examples. 5–6 The student: i. uses considerable relevant vocabulary, often accurately ii. demonstrates substantial knowledge and understanding of content and concepts through descriptions, explanations and examples. 7–8 The student: i. consistently uses relevant vocabulary accurately ii. demonstrates excellent knowledge and understanding of content and concepts through detailed descriptions, explanations and examples. |
Criterion C: Communicating
i. communicate information and ideas with clarity ii. organise information and ideas effectively for the task iii. list sources of information in a way that follows the task instructions. 0 The student does not reach a standard described by any of the descriptors below. 1–2 The student: i. communicates information and ideas in a style that is not always clear ii. organises information and ideas in a limited way iii. inconsistently lists sources, not following the task instructions. 3–4 The student: i. communicates information and ideas in a way that is somewhat clear ii. somewhat organises information and ideas iii. lists sources in a way that sometimes follows the task instructions. 5–6 The student: i. communicates information and ideas in a way that is mostly clear ii. mostly organises information and ideas iii. lists sources in a way that often follows the task instructions. 7–8 The student: i. communicates information and ideas in a way that is completely clear ii. completely organises information and ideas effectively iii. lists sources in a way that always follows the task instructions. |
